해당 포스트는 필자가 직접 풀이한 것으로 오답이나 잘못된 해석이 있을 수도 있습니다.
혹시나 지적할 부분이 있다면 항상 환영입니다! 😏
해당 포스트는 코드가 너무 길고 줄맞춤의 문제가 있어 사진으로 대체합니다 😓
문제 및 풀이
1. First, open two separate terminal connections to the same machine, so that you can easily run something in one window and the other. Now, in one window, run vmstat 1, which shows statistics about machine usage every second. Read the man page, the associated README, and any other information you need so that you can understand its output. Leave this window running vmstat for the rest of the exercises below. Now, we will run the program mem.c but with very little memory usage. This can be accomplished by typing ./mem 1 (which uses only 1 MB of memory). How do the CPU usage statistics change when running mem? Do the numbers in the user time column make sense? How does this change when running more than one instance of mem at once?
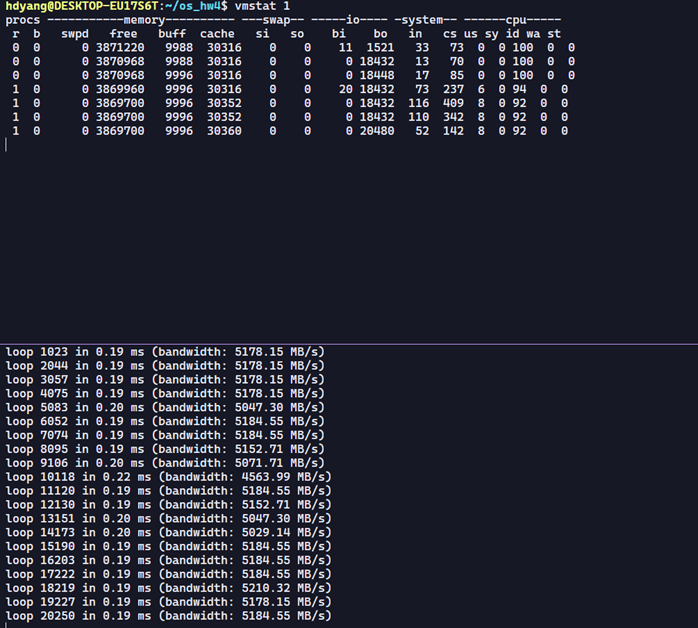
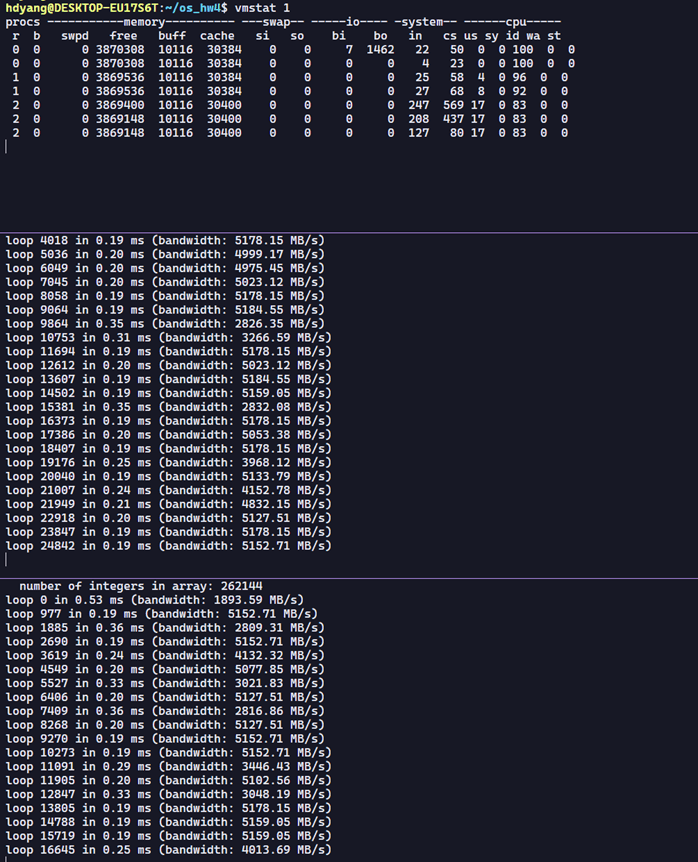
2. Let’s now start looking at some of the memory statistics while running mem. We’ll focus on two columns: swpd (the amount of virtual memory used) and free (the amount of idle memory). Run ./mem 1024 (which allocates 1024 MB) and watch how these values change. Then kill the running program (by typing control-c) and watch again how the values change. What do you notice about the values? In particular, how does the free column change when the program exits? Does the amount of free memory increase by the expected amount when mem exits?

3. We’ll next look at the swap columns (si and so), which indicate how much swapping is taking place to and from the disk. Of course, to activate these, you’ll need to run mem with large amounts of memory. First, examine how much free memory is on your Linux system (for example, by typing cat /proc/meminfo; type man proc for details on the /proc file system and the types of information you can find there). One of the first entries in /proc/meminfo is the total amount of memory in your system. Let’s assume it’s something like 8 GB of memory; if so, start by running mem 4000 (about 4 GB) and watching the swap in/out columns. Do they ever give non-zero values? Then, try with 5000, 6000, etc. What happens to these values as the program enters the second loop (and beyond), as compared to the first loop? How much data (total) are swapped in and out during the second, third, and subsequent loops? (do the numbers make sense?)
메모리는 4기가를 가지고 있다. 그래서 2048부터 시작하였다.


4. Do the same experiments as above, but now watch the other statistics (such as CPU utilization, and block I/O statistics). How do they change when mem is running?
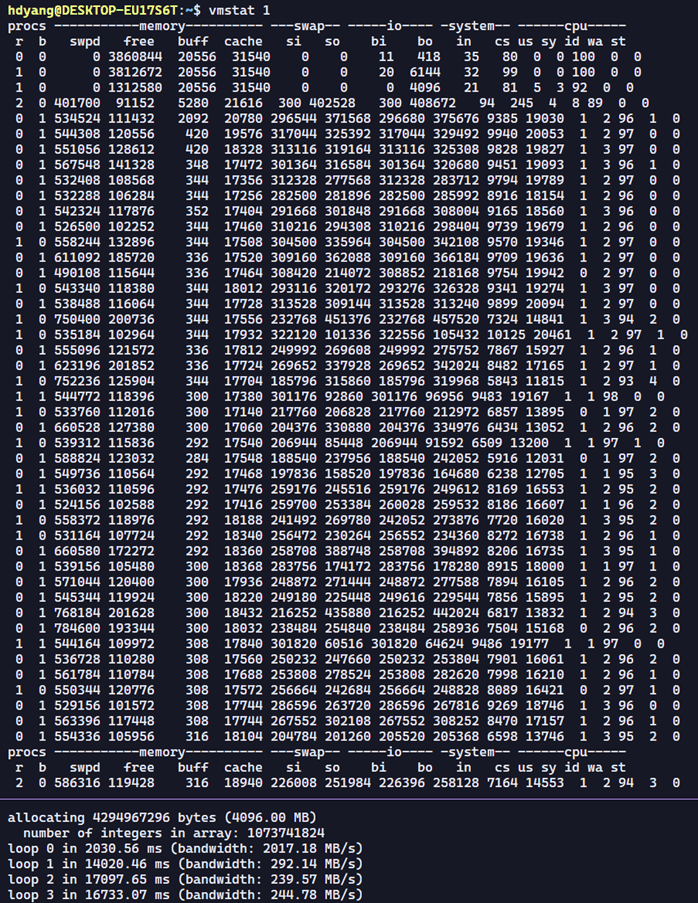
5. Now let’s examine performance. Pick an input for mem that comfortably fits in memory (say 4000 if the amount of memory on the system is 8 GB).How long does loop 0 take (and subsequent loops 1, 2, etc.)? Now pick a size comfortably beyond the size of memory (say 12000 again assuming 8 GB of memory). How long do the loops take here? How do the bandwidth numbers compare? How different is performance when constantly swapping versus fitting everything comfortably in memory? Can you make a graph, with the size of memory used by mem on the x-axis, and the bandwidth of accessing said memory on the y-axis? Finally, how does the performance of the first loop compare to that of subsequent loops, for both the case where everything fits in memory and where it doesn’t?


6. Swap space isn’t infinite. You can use the tool swapon with the -s flag to see how much swap space is available. What happens if you try to run mem with increasingly large values, beyond what seems to be available in swap? At what point does the memory allocation fail?


7. Finally, if you’re advanced, you can configure your system to use different swap devices using swapon and swapoff. Read the man pages for details. If you have access to different hardware, see how the performance of swapping changes when swapping to a classic hard drive, a flash-based SSD, and even a RAID array. How much can swapping performance be improved via newer devices? How close can you get to in-memory performance?
본인이 테스트한 환경은 SSD 밖에 없어서 HDD와의 비교는 불가능 하지만, SSD가 기존 HDD보다는 5~6배 혹은 그 이상 빠르다는 점을 감안하면 스왑시 속도와 bandwidth 가 훨씬 더 우월하다는 점을 알 수있다. 다만, 이렇게 하더라도 메모리보다는 훨씬 느리다. 듀얼 채널로 구성된 본인의 메모리 대역폭은 5000 MB/s를 넘어가기 때문이다.
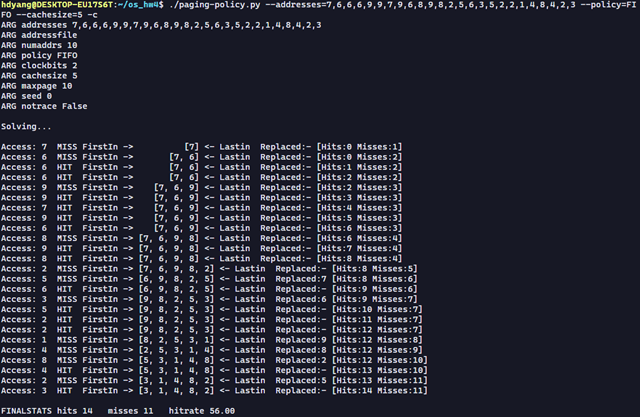
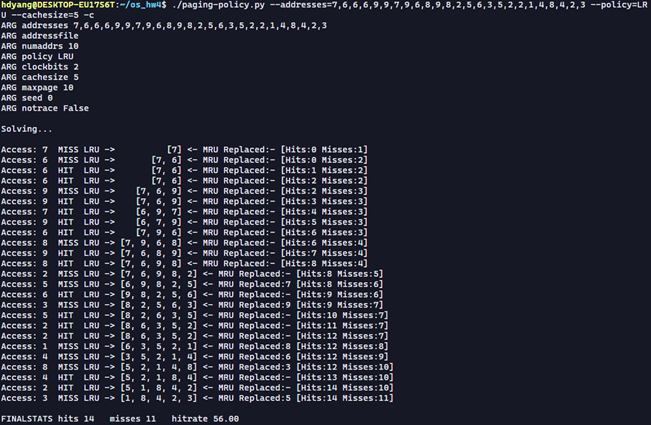
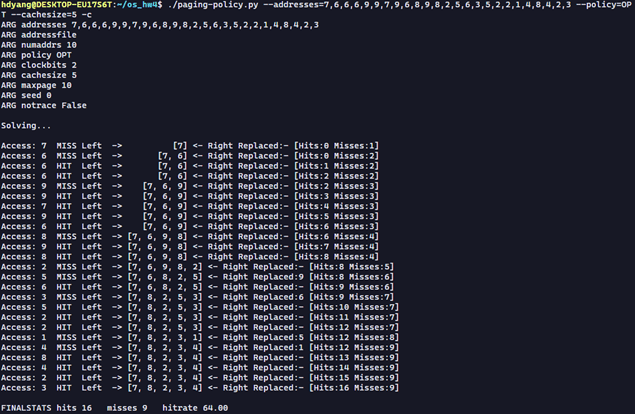
- Generate random addresses with the following arguments: -s 0 -n 10, -s 1 -n 10, and -s 2 -n 10. Change the policy from FIFO, to LRU, to OPT. Compute whether each access in said address traces are hits or misses.
-s 2 -n 10 일때
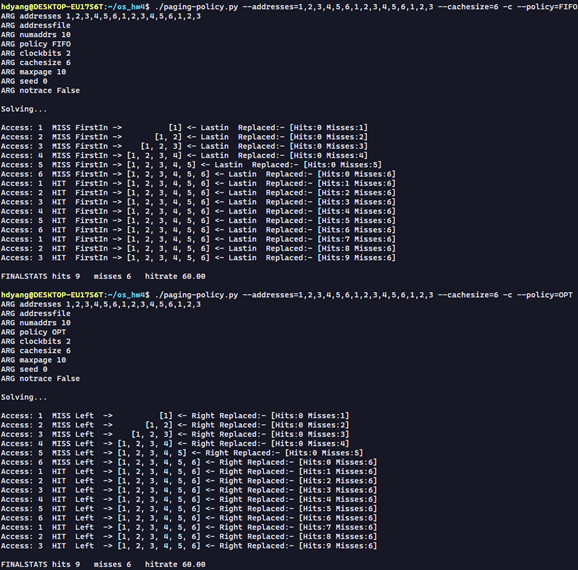
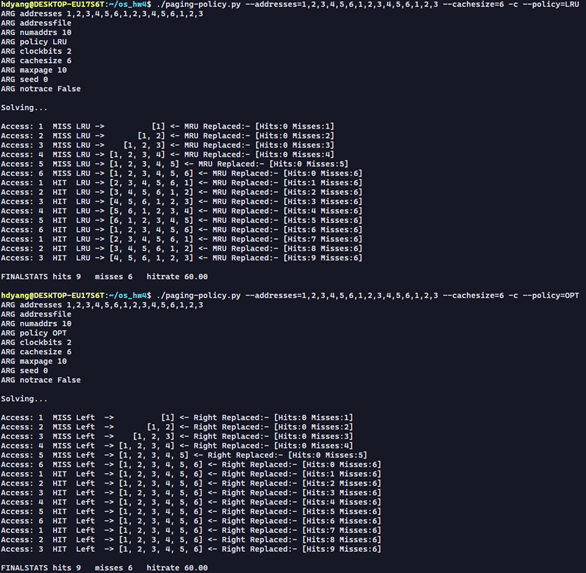
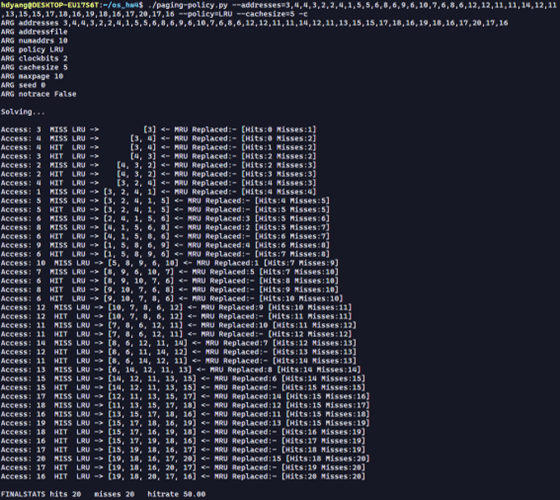
- For a cache of size 5, generate worst-case address reference streams for each of the following policies: FIFO, LRU, and MRU (worst-case reference streams cause the most misses possible. For the worst case reference streams, how much bigger of a cache is needed to improve performance dramatically and approach OPT?
캐시 사이즈를 6으로 하니 OPT와 동일해진다.
LRU의 경우
캐시 사이즈를 6으로 하니 OPT와 동일해진다.
캐시 사이즈를 6으로 하니 OPT와 동일해진다.
- Generate a random trace (use python or perl). How would you expect the different policies to perform on such a trace?
- Now generate a trace with some locality. How can you generate such a trace? How does LRU perform on it? How much better than RAND is LRU? How does CLOCK do? How about CLOCK with different numbers of clock bits?
locality를 고려한 랜덤 코드 – 총 4개의 구간으로 나누어서 특정 범위만 반복되게 지역성을 주었다.

LRU가 조금 더 좋은 성능을 보여준다.
CLOCK의 경우

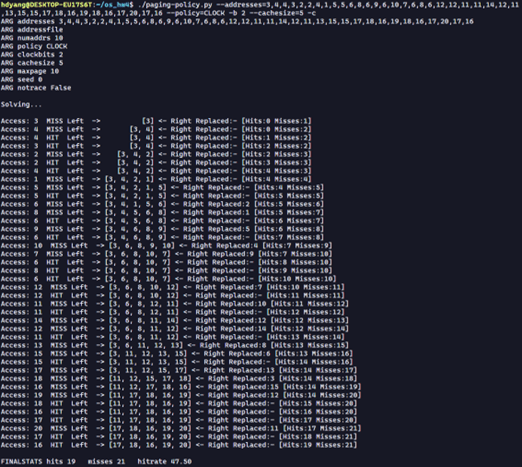
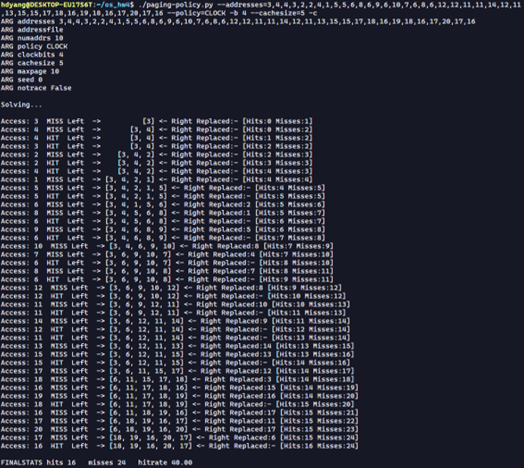
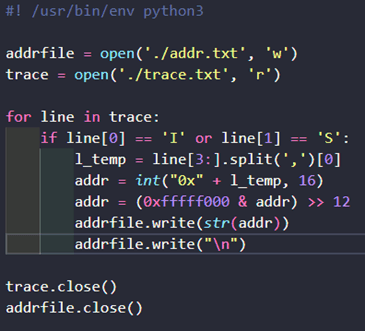
clock bits 0,2,4로 바꾸니 hit가 더 많아지기도 하고 적어지기도 한다. 5. Use a program like valgrind to instrument a real application and generate a virtual page reference stream. For example, running valgrind –tool=lackey –trace-mem=yes ls will output a nearly-complete reference trace of every instruction and data reference made by the program ls. To make this useful for the simulator above, you’ll have to first transform each virtual memory reference into a virtual page-number reference (done by masking off the offset and shifting the resulting bits downward). How big of a cache is needed for your application trace in order to satisfy a large fraction of requests? Plot a graph of its working set as the size of the cache increases.
마스킹에 사용한 코드 – 하위 12개 offset 비트 masking off the offset and shifting

결과
Source
- 『Operating Systems: Three Easy Pieces』 -Remzi H. Arpaci-Dusseau 지음
https://pages.cs.wisc.edu/~remzi/OSTEP/
-
-
- 1. First, open two separate terminal connections to the same machine, so that you can easily run something in one window and the other. Now, in one window, run vmstat 1, which shows statistics about machine usage every second. Read the man page, the associated README, and any other information you need so that you can understand its output. Leave this window running vmstat for the rest of the exercises below. Now, we will run the program mem.c but with very little memory usage. This can be accomplished by typing ./mem 1 (which uses only 1 MB of memory). How do the CPU usage statistics change when running mem? Do the numbers in the user time column make sense? How does this change when running more than one instance of mem at once?
- 2. Let’s now start looking at some of the memory statistics while running mem. We’ll focus on two columns: swpd (the amount of virtual memory used) and free (the amount of idle memory). Run ./mem 1024 (which allocates 1024 MB) and watch how these values change. Then kill the running program (by typing control-c) and watch again how the values change. What do you notice about the values? In particular, how does the free column change when the program exits? Does the amount of free memory increase by the expected amount when mem exits?
- 3. We’ll next look at the swap columns (si and so), which indicate how much swapping is taking place to and from the disk. Of course, to activate these, you’ll need to run mem with large amounts of memory. First, examine how much free memory is on your Linux system (for example, by typing cat /proc/meminfo; type man proc for details on the /proc file system and the types of information you can find there). One of the first entries in /proc/meminfo is the total amount of memory in your system. Let’s assume it’s something like 8 GB of memory; if so, start by running mem 4000 (about 4 GB) and watching the swap in/out columns. Do they ever give non-zero values? Then, try with 5000, 6000, etc. What happens to these values as the program enters the second loop (and beyond), as compared to the first loop? How much data (total) are swapped in and out during the second, third, and subsequent loops? (do the numbers make sense?)
- 4. Do the same experiments as above, but now watch the other statistics (such as CPU utilization, and block I/O statistics). How do they change when mem is running?
- 5. Now let’s examine performance. Pick an input for mem that comfortably fits in memory (say 4000 if the amount of memory on the system is 8 GB).How long does loop 0 take (and subsequent loops 1, 2, etc.)? Now pick a size comfortably beyond the size of memory (say 12000 again assuming 8 GB of memory). How long do the loops take here? How do the bandwidth numbers compare? How different is performance when constantly swapping versus fitting everything comfortably in memory? Can you make a graph, with the size of memory used by mem on the x-axis, and the bandwidth of accessing said memory on the y-axis? Finally, how does the performance of the first loop compare to that of subsequent loops, for both the case where everything fits in memory and where it doesn’t?
- 6. Swap space isn’t infinite. You can use the tool swapon with the -s flag to see how much swap space is available. What happens if you try to run mem with increasingly large values, beyond what seems to be available in swap? At what point does the memory allocation fail?
- 7. Finally, if you’re advanced, you can configure your system to use different swap devices using swapon and swapoff. Read the man pages for details. If you have access to different hardware, see how the performance of swapping changes when swapping to a classic hard drive, a flash-based SSD, and even a RAID array. How much can swapping performance be improved via newer devices? How close can you get to in-memory performance?
-


